
Analysis
Uploading data and the spreadsheet
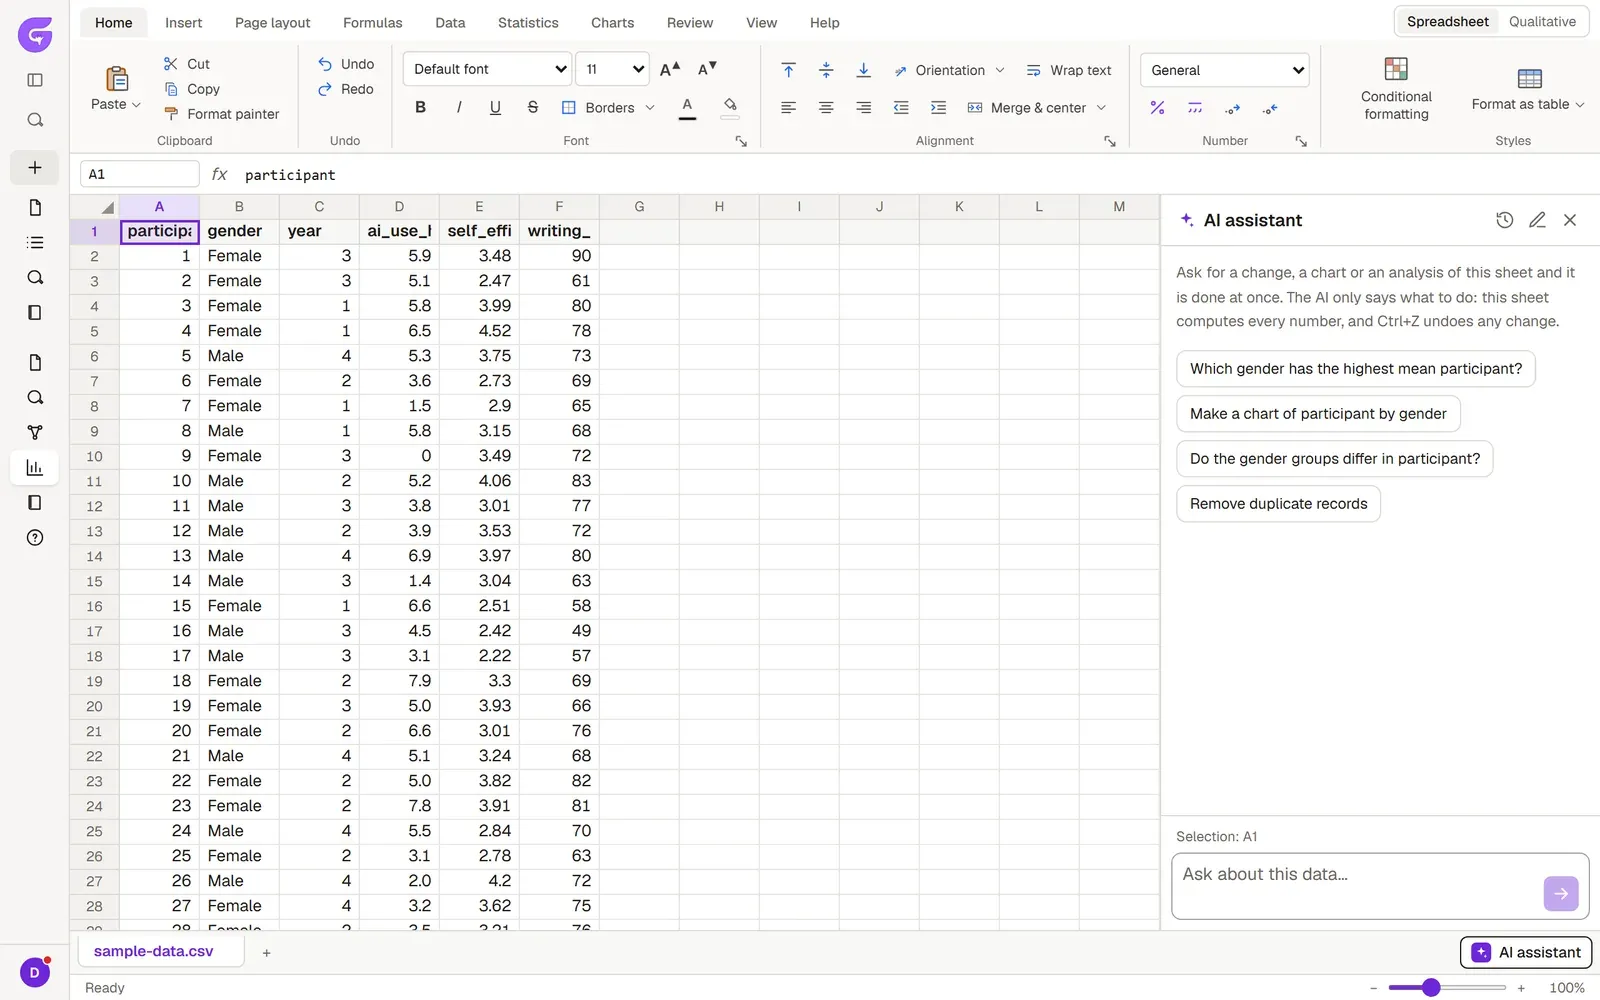
You open your data in the spreadsheet on the document’s Analysis tab; Grongy calculates statistics and charts from this sheet. It opens and saves .xlsx files, and you don’t need to write any code.
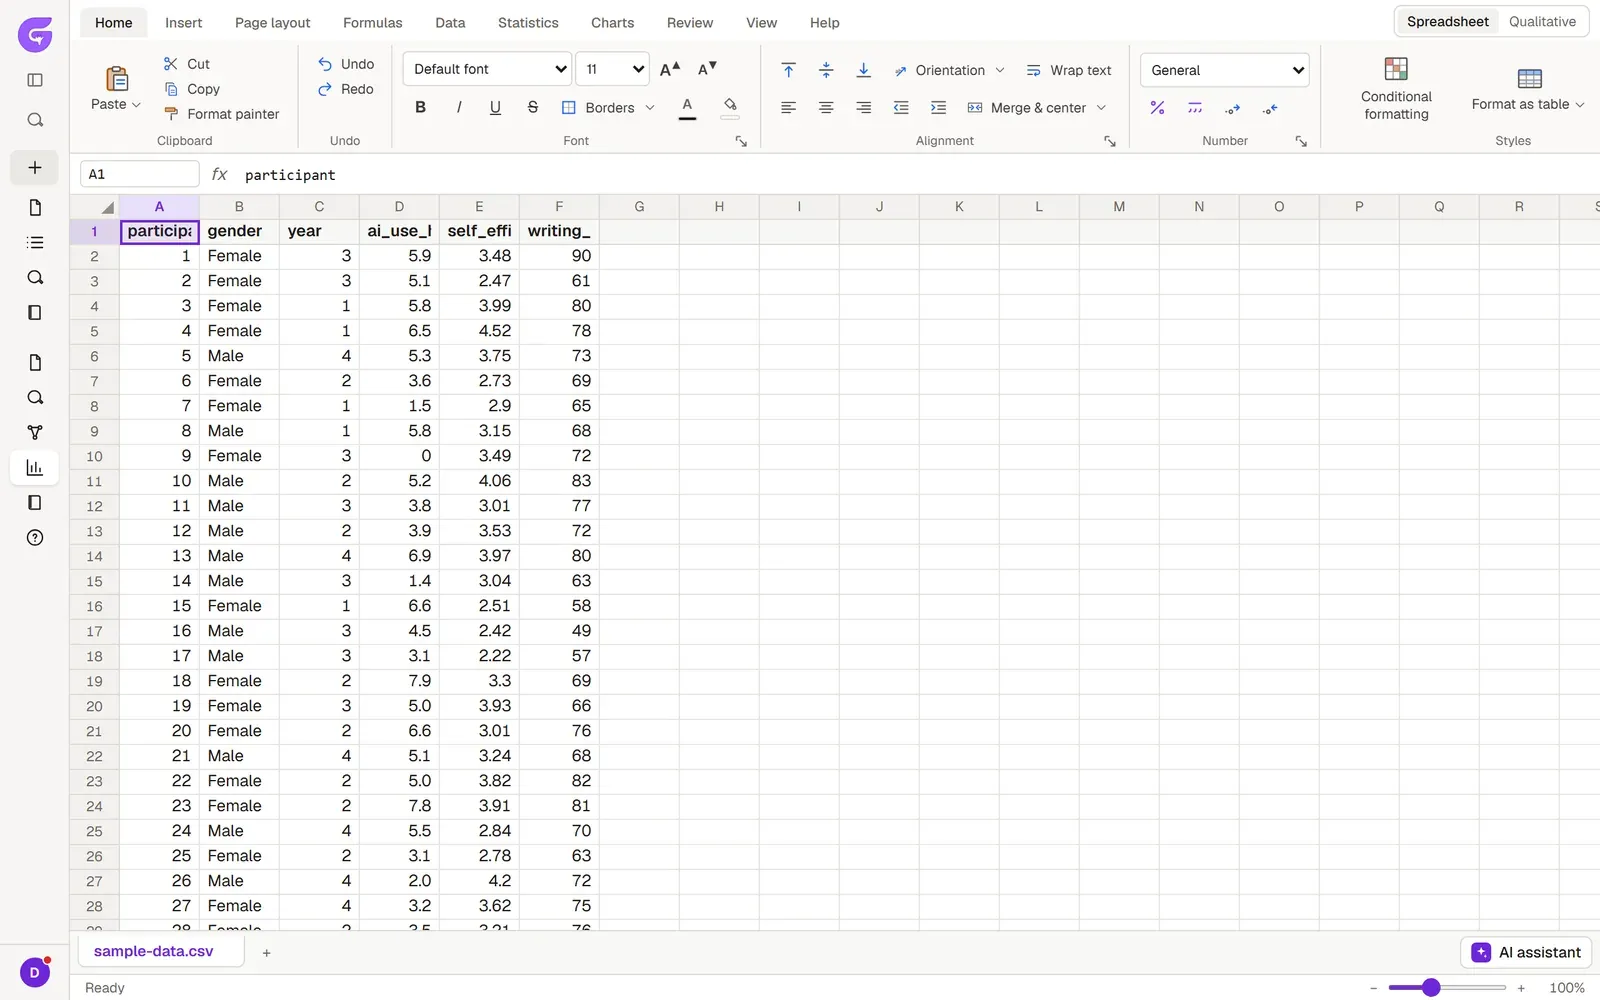
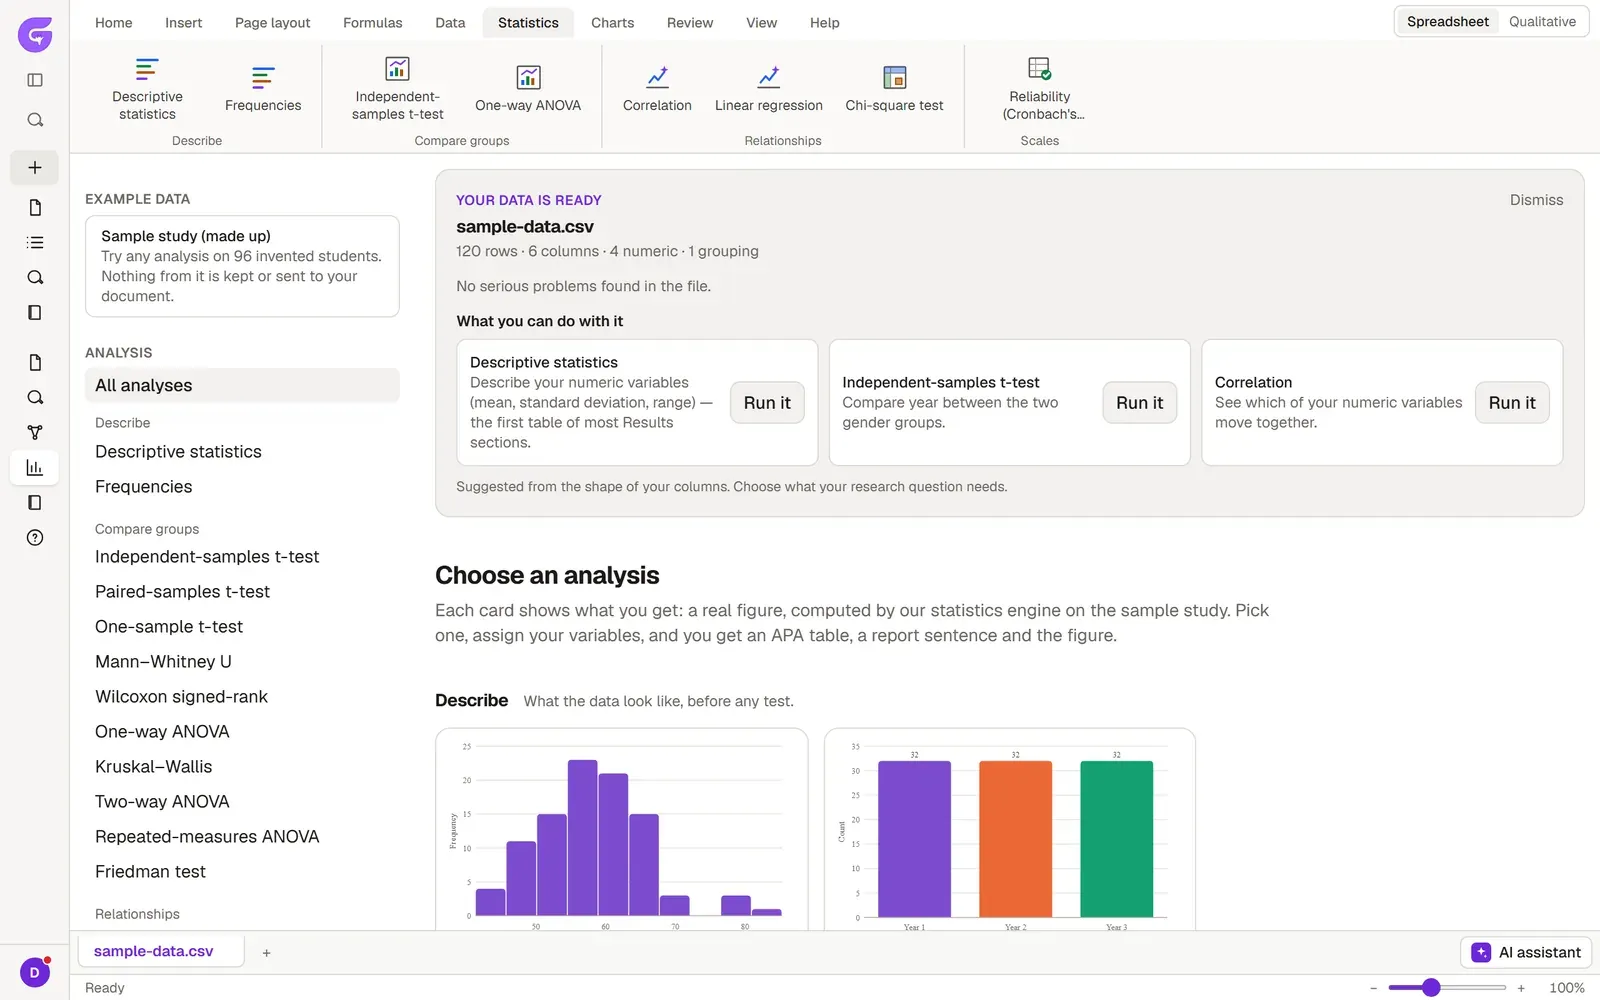
The ribbon at the top has these tabs: Home, Insert, Page layout, Formulas, Data, Statistics, Charts, Review, View, Help. Each sheet tab at the bottom is a separate dataset. The data in the screenshot is available with English column names as sample-data.csv; the Sample files page explains its columns.
Where the Analysis tab is
Section titled “Where the Analysis tab is”The Analysis tab sits on the left edge of the document, marked BETA. It appears only for document types that can have data of their own: Thesis / dissertation, Research paper, Case study and Report.
The tab opens on the chat: drop your file in the box and write what you want done. Tests and charts run inside the message, and changes such as a new column or a clean-up go into the table and can be undone in one click.
The buttons at the top right of the tab switch the view: Chat, Spreadsheet to work by hand, Qualitative for interview transcripts. If you pick the spreadsheet, the tab opens there next time. The Qualitative analysis page covers the qualitative side.
The Upload data and Check & clean buttons on the editor’s Analysis ribbon also bring you here. In a document without an Analysis tab, such as an essay, the same buttons open a small data panel beside the page.
Opening a file
Section titled “Opening a file”- Open the Analysis tab, with Spreadsheet selected.
- Switch to the Data tab on the ribbon and click Open a file in the Get data group.
- Choose your file: .csv, .tsv, .txt, .xlsx, .xls, .ods (LibreOffice), .sav, .zsav or .por (SPSS), .dta (Stata), or .sas7bdat or .xpt (SAS). Grongy reads the file in your browser.
- Each sheet in the workbook opens as its own tab at the bottom. Each tab is a separate dataset, and Grongy calculates statistics from whichever tab is selected.
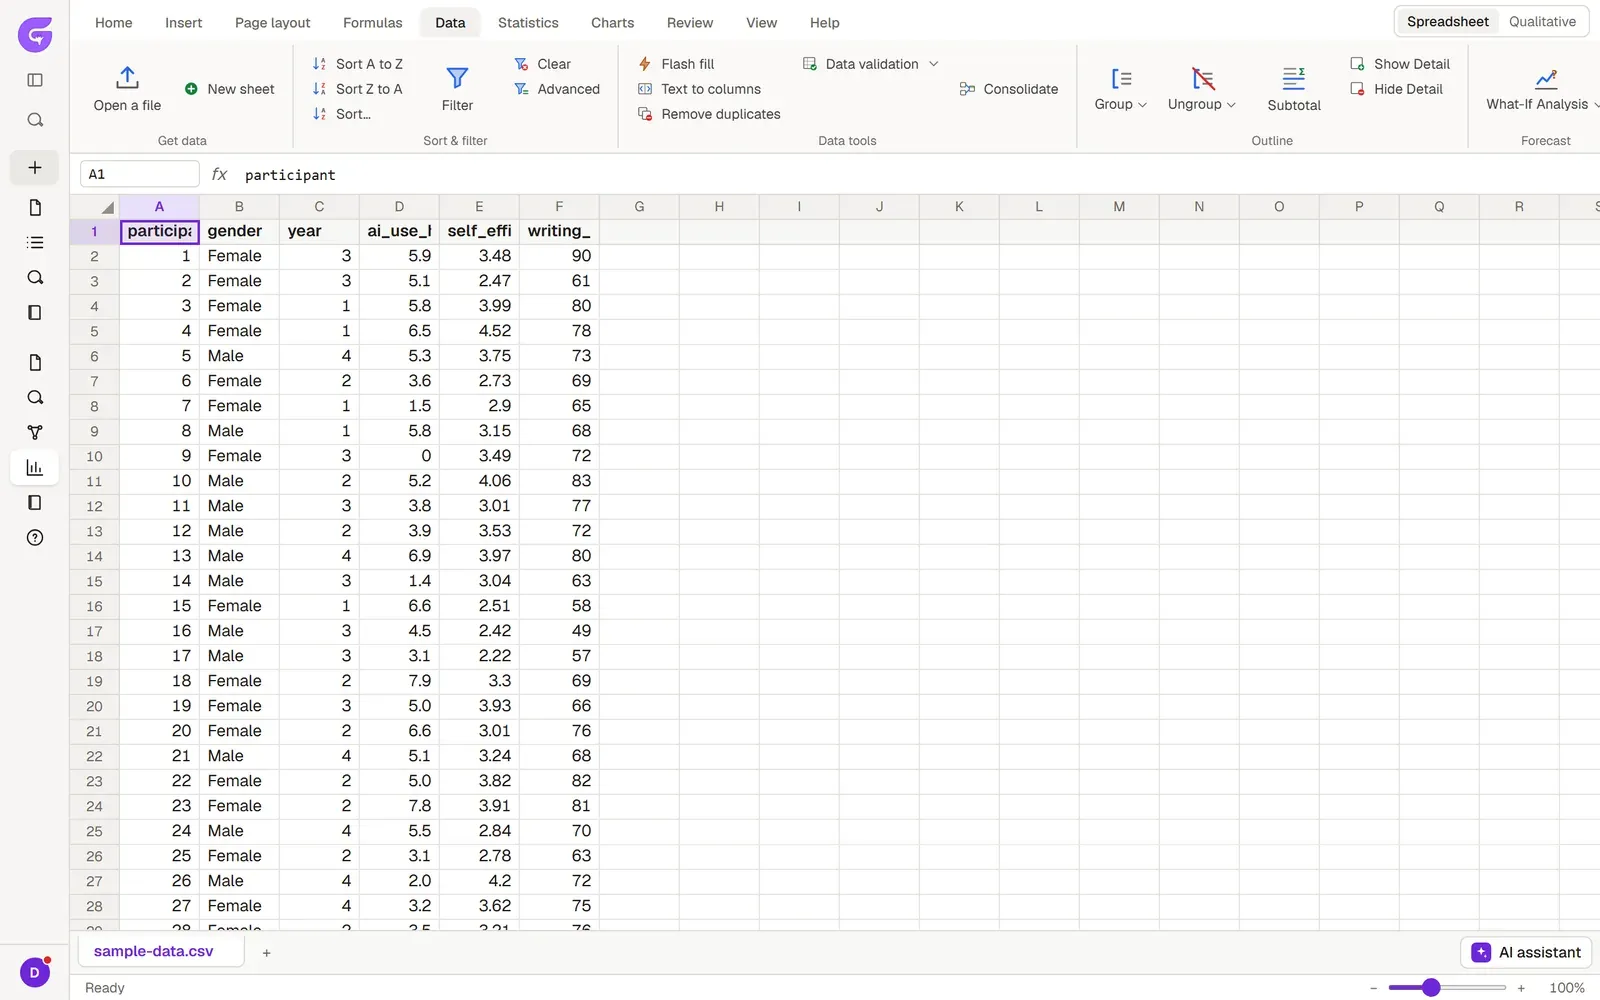
You can also type data straight into the cells or paste it in from elsewhere. The + button at the bottom opens an empty New sheet. With a very large file, Grongy reads only the first 20,000 rows and tells you so in a note.
Numbers with a decimal comma
Section titled “Numbers with a decimal comma”A decimal comma, as Turkish uses it, causes no trouble: Grongy reads 3,5 as 3.5 and 1.250,75 as 1250.75. For a value like 1.250, which can be read two ways, it decides by looking at the rest of the column. Every calculation uses the same reading; a cell never counts as 3.5 in one place and 35 in another.
With the interface in Turkish, you separate a formula’s arguments with ; and use Turkish names such as TOPLA (SUM), ORTALAMA (AVERAGE) and EĞER (IF). English names work too.
Check & clean
Section titled “Check & clean”Before you start the analysis, find and fix the problems in your data.
- On the Data tab, click Check & clean in the Prepare group.
- The What the data looks like section lists the findings, such as duplicate rows, missing or outlying values, mixed decimal marks and inconsistently written labels. Grongy calculates these numbers from your file; it does not guess.
- Fix a finding with one click, or get a Suggested steps list with Ask the AI for advice. Nothing is applied unless you tick it; you apply the steps you chose with Apply selected.
- What you apply builds up in the What was done list. Insert this into my methods section writes these cleaning steps into your document.
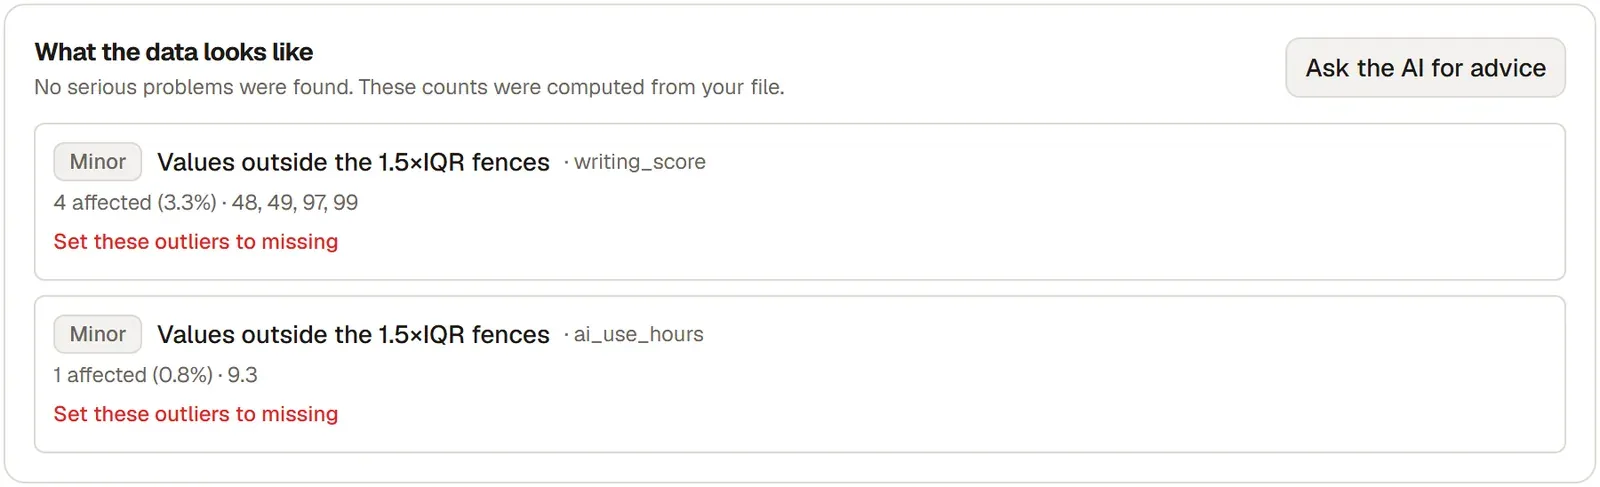
Your original file is kept as it was; Undo all cleaning returns everything to its first state.
Your data is ready
Section titled “Your data is ready”When you open a file, a Your data is ready card appears on the Statistics tab. The card shows the number of rows and columns, how many numeric and grouping variables you have and, if there is one, a point you should check. Below it, the analyses that fit the structure of your columns are listed, each with a Run it button. The analyses are covered in detail on the Statistics page.
Defining variables
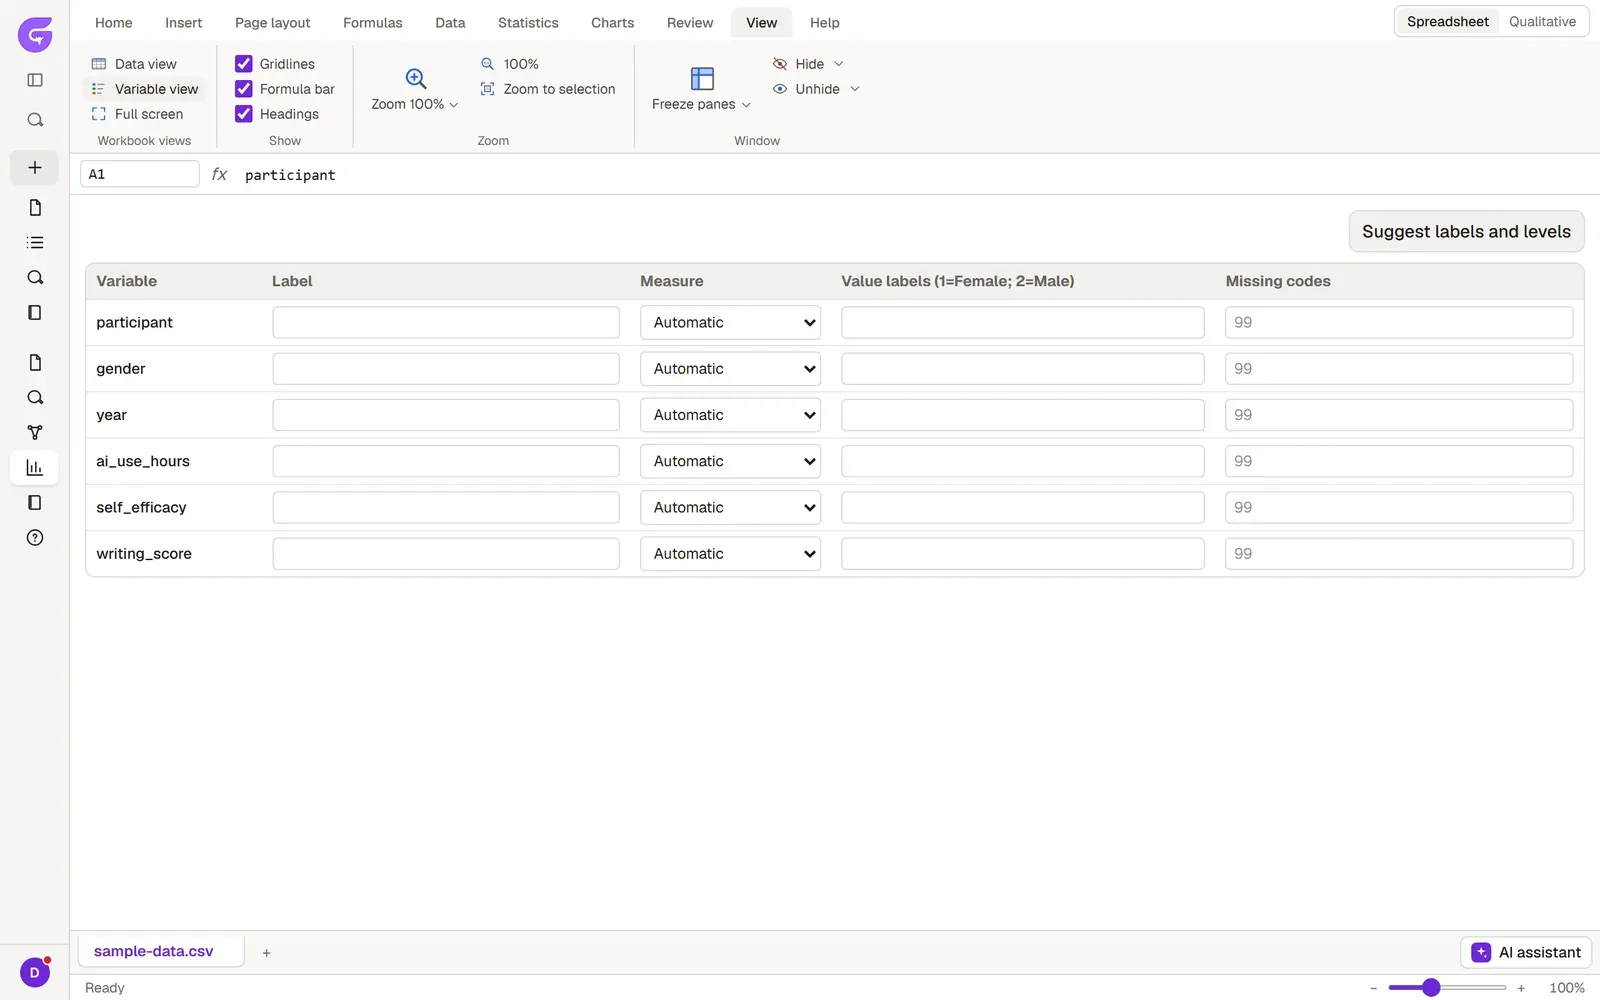
Section titled “Defining variables”On the View tab, switch to Variable view. Here you enter, for each column:
- a Label,
- the Measure: Nominal, Ordinal or Scale,
- Value labels (1=Female; 2=Male),
- Missing codes, for example 99.
Codes you mark as missing do not enter calculations as numbers. Value labels appear in tables in place of the codes. The values in the data themselves do not change here.
AI assistant
Section titled “AI assistant”The AI assistant button at the bottom right of the sheet opens a chat. Ask for a change, a chart or an analysis in your own words, and the assistant does it right away. The AI only decides what to do; the sheet calculates the numbers. You undo a change you don’t like with Ctrl+Z.