

Analysis
Sending a result to your document
You never retype an analysis result by hand: the table, the sentence and the figure land in your document where you left the cursor.

Sending from the Analysis page
Section titled “Sending from the Analysis page”-
Click where the result should go in the document, for example at the end of a paragraph in the Results chapter. Then switch to the Analysis tab.
-
Run your analysis; the steps are on the Statistics page.
-
Click one of the two buttons below the result:
- Send with the figure sends the APA table, the sentence and the figure.
- Send the table and sentence only leaves the figure out.
Analyses without a figure have a single button: Send to document.
-
Grongy takes you to the Write tab and adds the result where you left off. If there is no cursor, it adds it at the end of the document.
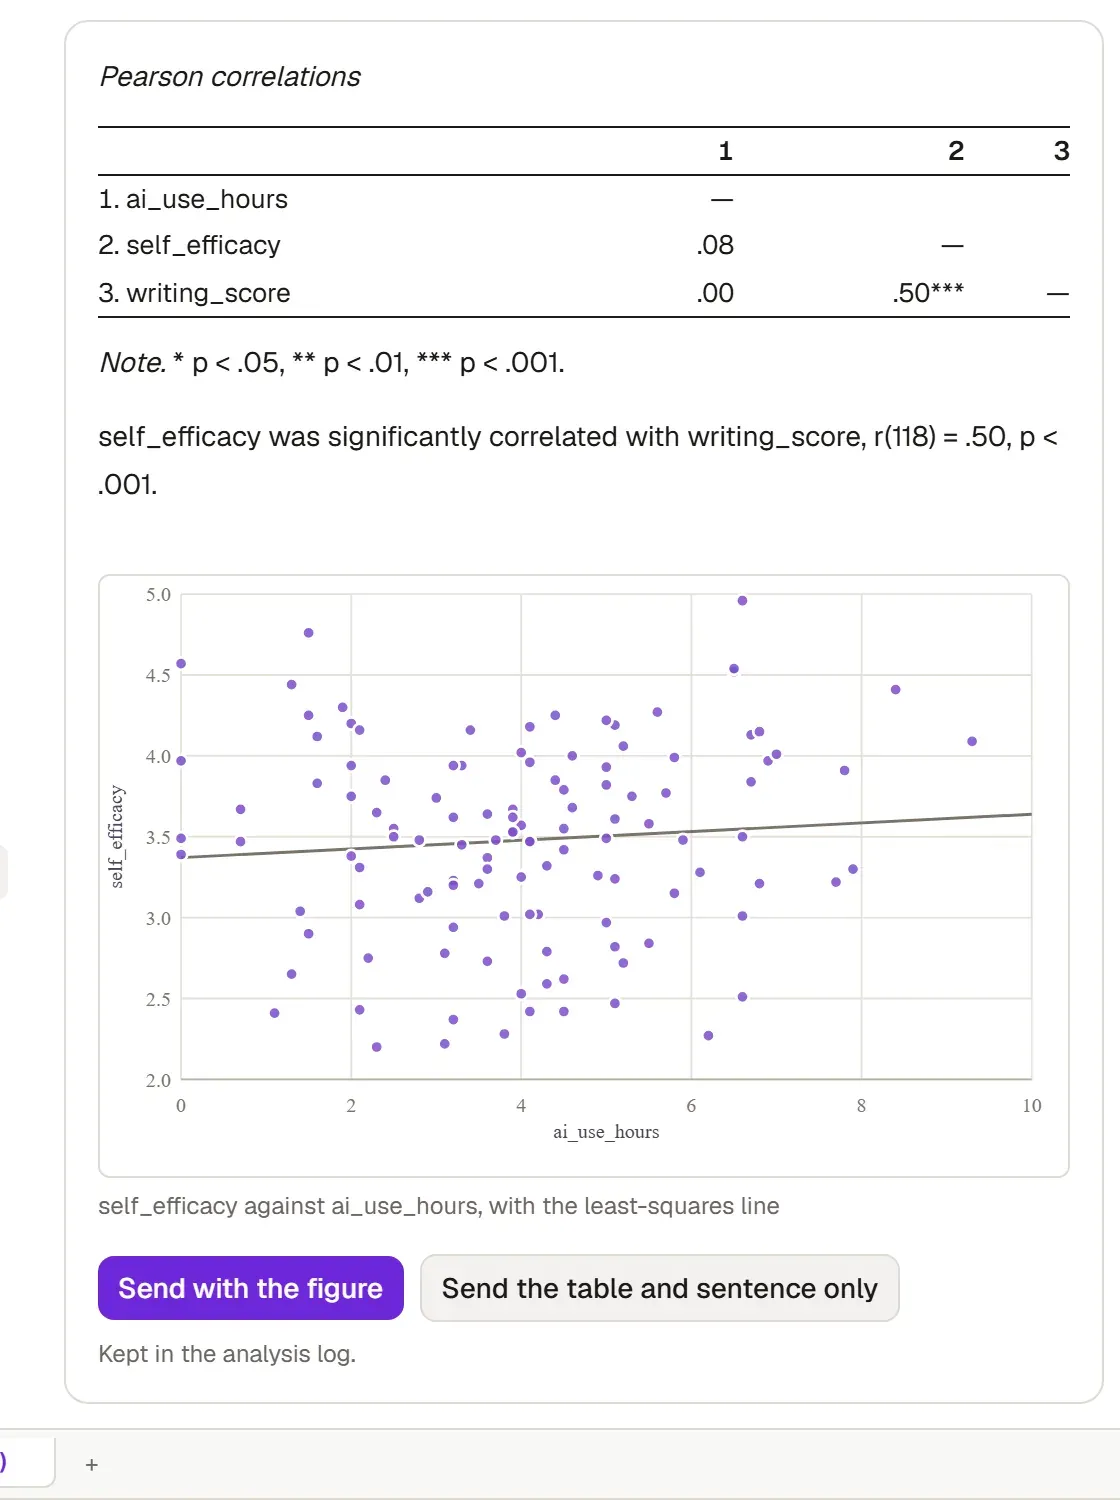
The figure arrives with a caption; the document numbers it itself. For results that carry an assumption note, an Assumption checks block is added below the table too. Keep what your Results chapter needs to report and delete the rest.
Insert a result from the editor
Section titled “Insert a result from the editor”Every analysis you run is kept in the Analysis log, so you can add a result to your document later as well.
- In the Write tab, put the cursor where the result should go.
- Open the Analysis tab on the editor ribbon and click Insert a result. The number beside the button shows how many results the log holds.
- Find the result in the list. Each result shows the name of the analysis and the dataset, the date and the reporting sentence.
- Choose Insert with the figure or Table and sentence only. Results without a figure show only Insert.
If the log has no results yet, the list says so and shows an Open Analysis link. If the dataset has been deleted, the table and sentence are still inserted, but the figure cannot be drawn.
What else you can send
Section titled “What else you can send”Besides analysis results, you can bring these into your document:
- a figure you made on the Charts page, with Insert into the document,
- the sentence from a power analysis, with Send to document,
- the theme table and quotes from the Qualitative analysis screen, with Send the theme table to the document and Send with its quotes,
- your data-cleaning steps, with Insert this into my methods section in Check & clean.
After sending
Section titled “After sending”Grongy calculates the numbers from your data; interpreting them is up to you. Adapt the table title and the sentence to the voice of your chapter, and discuss the result in your own words. You can edit the inserted text in the document. The figure stays linked to your data; if you clean the data, it is redrawn.