

Analysis · Analysis and charts
Charts
You draw a figure from your spreadsheet data and insert it into your document. A statistical analysis brings its own figure along with the result; every other figure you make on the Charts page.
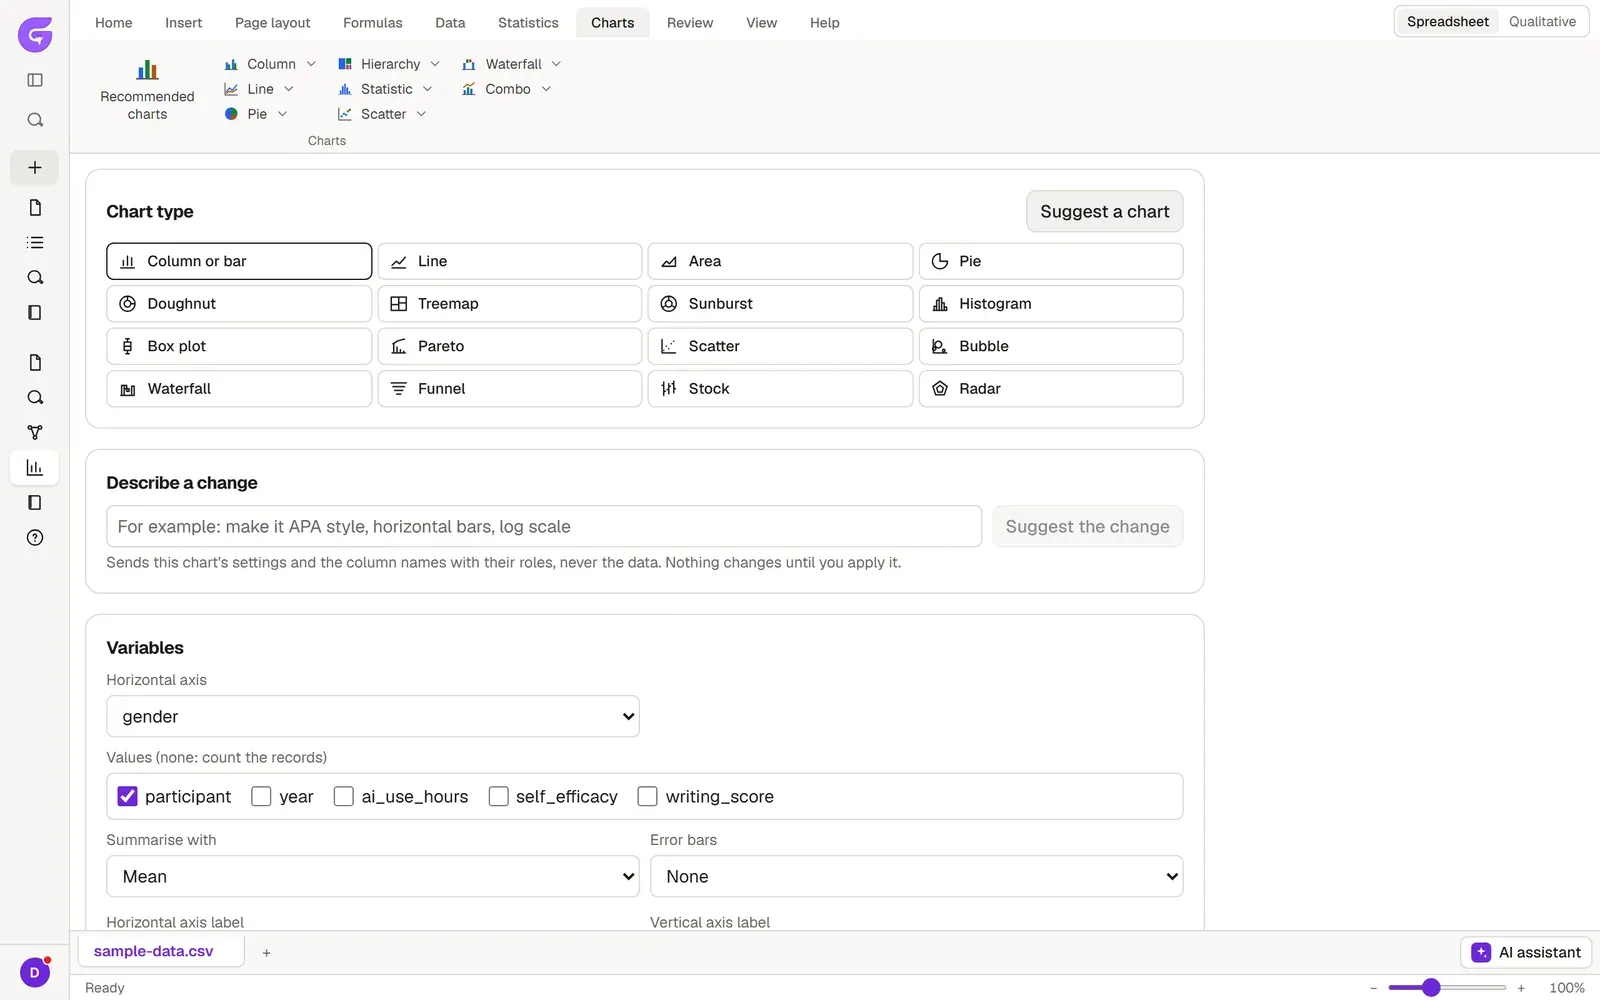
Opening the Charts page
Section titled “Opening the Charts page”- In the Analysis tab, open the Spreadsheet and select the columns you want to plot.
- Switch to the Charts tab on the ribbon.
- Click Recommended charts, or pick a type from one of these families: Column, Line, Pie, Hierarchy, Statistic (Histogram, Pareto, Box plot), Scatter, Waterfall and Combo.
- The chart opens on the Charts page with the columns you selected.
If the type you chose does not suit those columns, Grongy asks you to select other columns or to try Recommended charts.
Setting up the chart
Section titled “Setting up the chart”- When you change the Chart type, the columns you selected stay in place. Suggest a chart proposes a chart that fits your data.
- In the Variables section you choose which column goes on which axis. If needed, set how the values are summarized with Summarise with.
- If you leave Horizontal axis label and Vertical axis label empty, Grongy uses the labels from Variable view.
- Width is the figure’s width on the page, entered in centimeters.
- Under Axes, legend and labels you find Value axis minimum, Value axis maximum, Logarithmic scale, Legend, Data labels and Gridlines.
- Preview shows the figure as it will look in the document. Show the values as a table opens the plotted numbers in a table.
Changing it in words
Section titled “Changing it in words”Type the change you want in the Describe a change box, for example “APA style, horizontal bars, logarithmic scale”. Then click Suggest the change. The request sends the chart’s settings and the column names, not your data. Nothing changes until you click Apply; if you don’t want the suggestion, click Discard.
Grayscale printing
Section titled “Grayscale printing”Grongy draws analysis figures in color. If your thesis will be printed in black and white, check Pattern fills (for greyscale printing); the series are then told apart by pattern as well as by color, so they stay distinct in black-and-white print too.
Inserting it into the document
Section titled “Inserting it into the document”- Type the title in the Caption box. The document assigns and updates the figure number itself.
- Click Insert into the document.
- Grongy takes you to the Write tab and inserts the figure where you left the cursor.
The figure in the document stays linked to your data; when you clean the data, the figure is redrawn. If you delete the dataset, the figures in the document keep their last version.