
Walkthroughs
Data analysis
If your study has its own data, you run the analysis in Grongy and send the result straight to your document. You don’t need a separate statistics program, and you don’t write any code: Grongy does the calculations on your device.
-
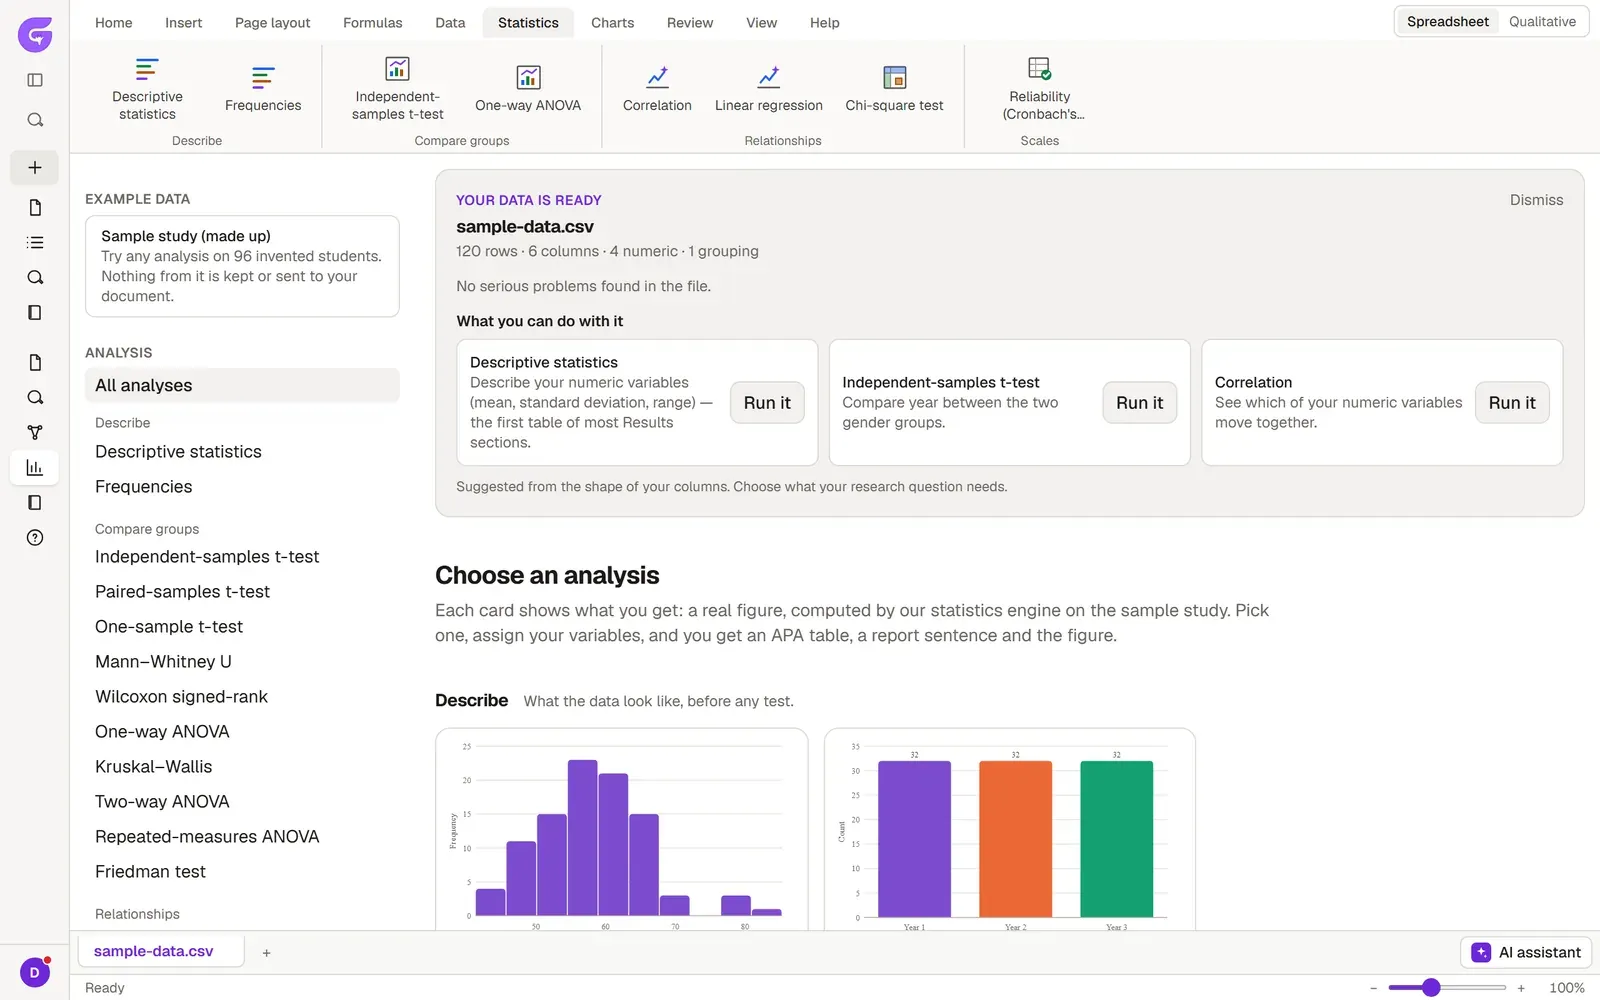
Open the document’s Analysis tab; it appears only for study types that have their own data. Upload your CSV or Excel file. Grongy recognizes the columns and suggests suitable analyses. Loading data lists the files you can open.
-
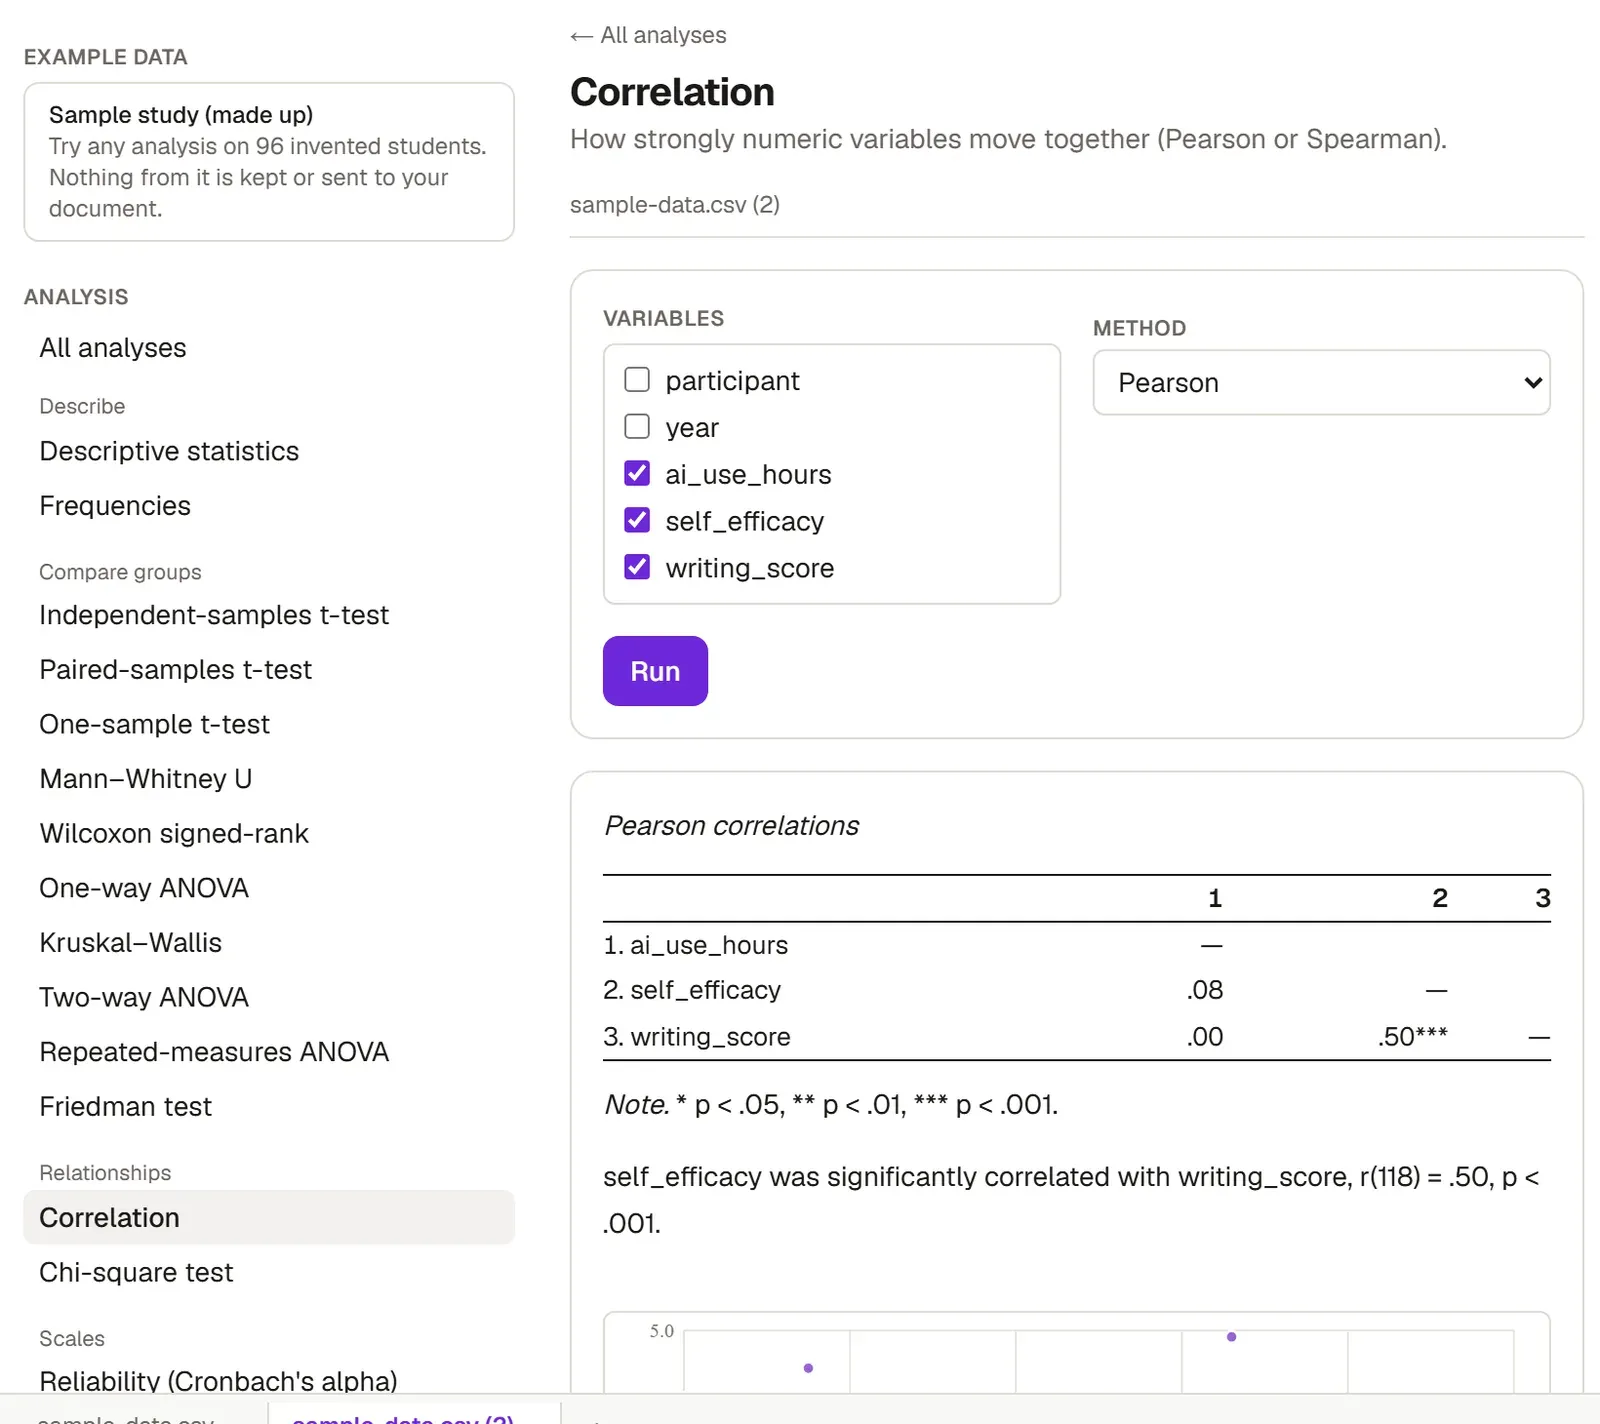
Pick an analysis from the Statistics tab on the ribbon, for example Correlation. Tick the variables and press Run. The full list of analyses is on Statistics.
-
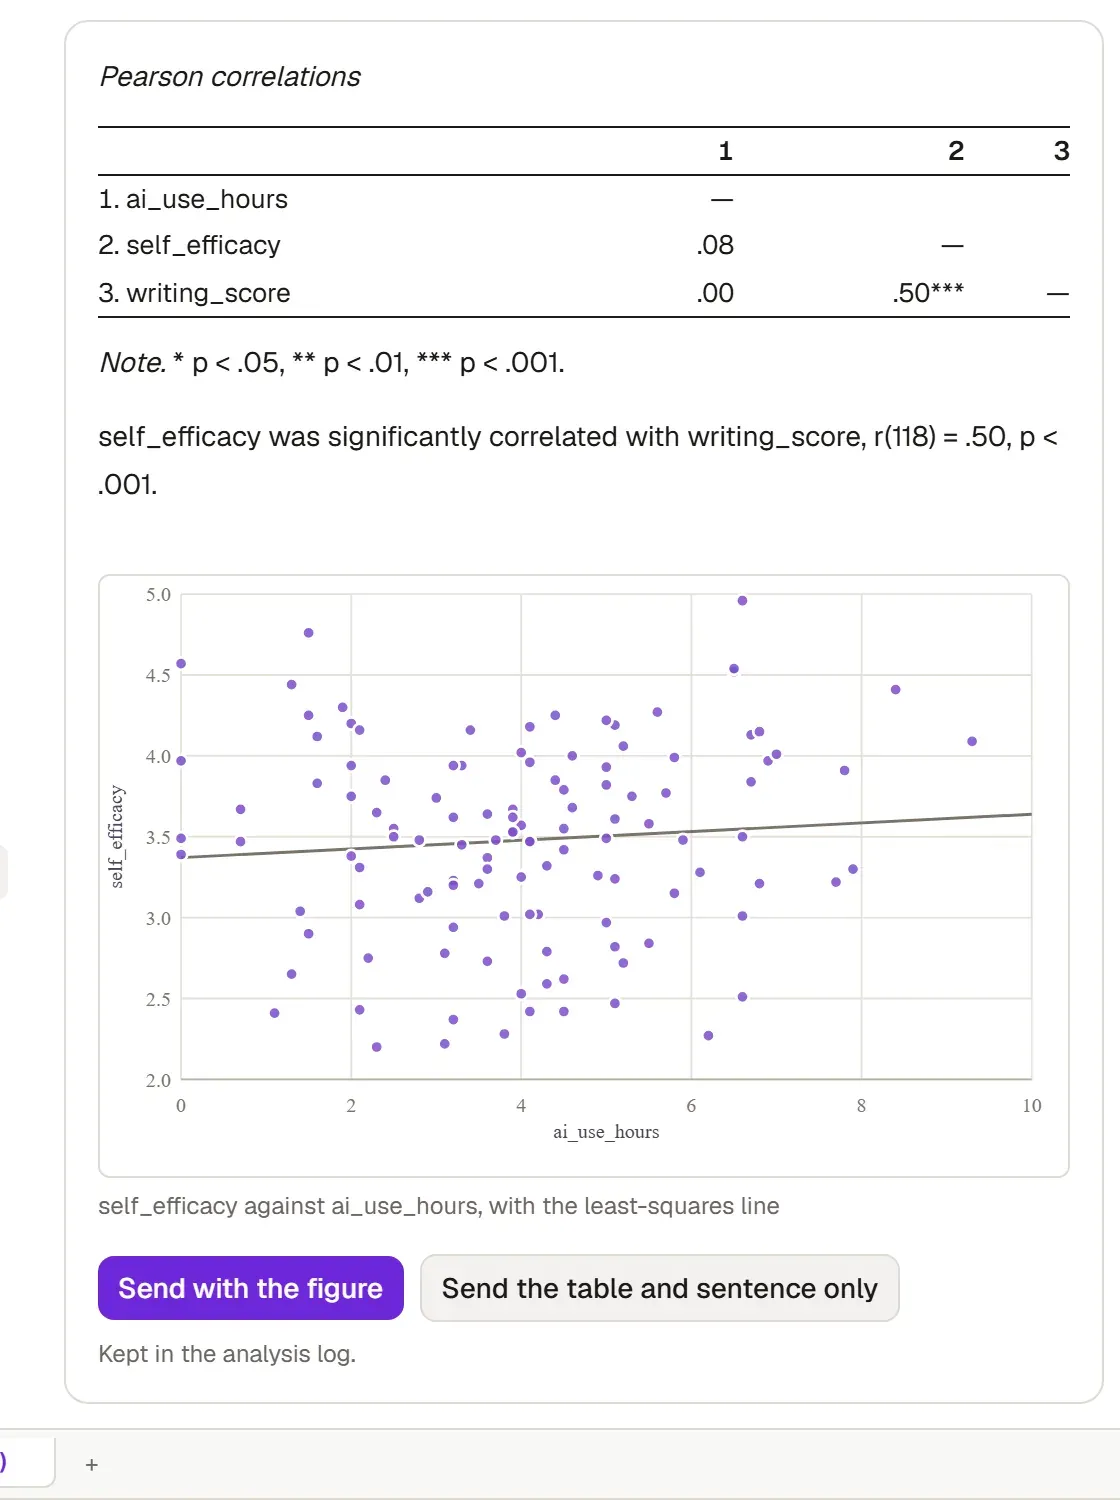
The result comes with its APA table, report sentence and chart ready. Add them all to the Results section with Send with the figure. The other ways to send a result are on Sending to the document.